What is tidy data?
I first came across the concept of “tidy data” in Petrou’s Panda Cookbook in chapter 8: restructuring data into a tidy form. Tidy data is a framework that Hadley Wickham developed to make datasets easier to manipulate for analysis.
A dataset is considered tidy if it meets these 3 principles
- each variable forms a column
- each observation forms a row
- and each type of observational unit forms a table
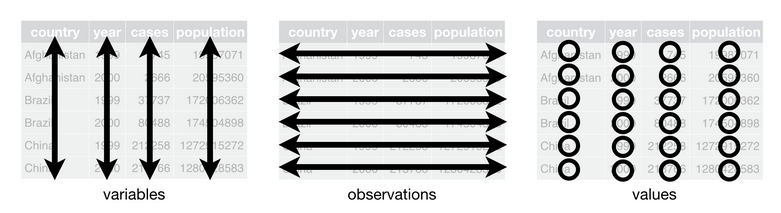
Figure 12.1 from R for Data Science by Hadley Wickham & Garrett Grolemund that illustrates the principles of tidy data.
Why tidy data matters (especially in pandas)?
pandas is column-oriented, meaning that most operations (like filtering, grouping, aggregation) assume that
- variables live in columns
- operations apply across entire columns
So when data is not tidy, you will need to write one-off transformations just to get the data into a usable shape. This introduces unnecessary complexity and makes analysis harder.
Basically, practicing a tidy data framework lets you reduce the number of special cases you need to handle in your code. As Wickham wrote, “Tidy data aligns the structure of the dataset with its meaning, making it easier to manipulate and analyze.”
Common problems with messy datasets
Wickham describes the five most common problems with messy data as
- column names are values, not variable names
- multiple variables are stored in column names
- variables are stored in both rows and columns
- multiple types of observational units are stored in the same table
- a single observational unit is stored in multiple tables
Most real-world datasets have at least one of these issues, if not more. But you can solve each of these problems with a small set of dataframe methods in pandas.
How to tidy messy data with pandas
Below is a table that takes the common problems of messy data and connects them to pandas method.
| Problem | What it looks like | Tidy goal | Typical pandas tools |
|---|---|---|---|
| Column names are values | wk1, wk2, wk3 | Move values out of headers and into rows | melt() |
| Multiple variables in one column name | m014, f1524 | Separate packed variables into columns | str.extract() / str.split() |
| Variables stored in both rows and columns | tmin / tmax listed as row values | Reshape variable values into columns | pivot() / unstack() |
| Multiple observational units in one table | song data + ranking data together | Create one table per observational unit | column selection + drop_duplicates()(then merge() if needed) |
| One observational unit spread across multiple tables | yearly files | Combine similar tables into one | concat() |
This cheat sheet summarizes these steps and is a helpful resource when applying tidy data principles with pandas.
Overall, tidy data is less about memorizing functions and more about recognizing patterns. Once you can identify how a dataset is“messy,” it becomes easier to select the appropriate pandas operation to tidy it.
Some Examples
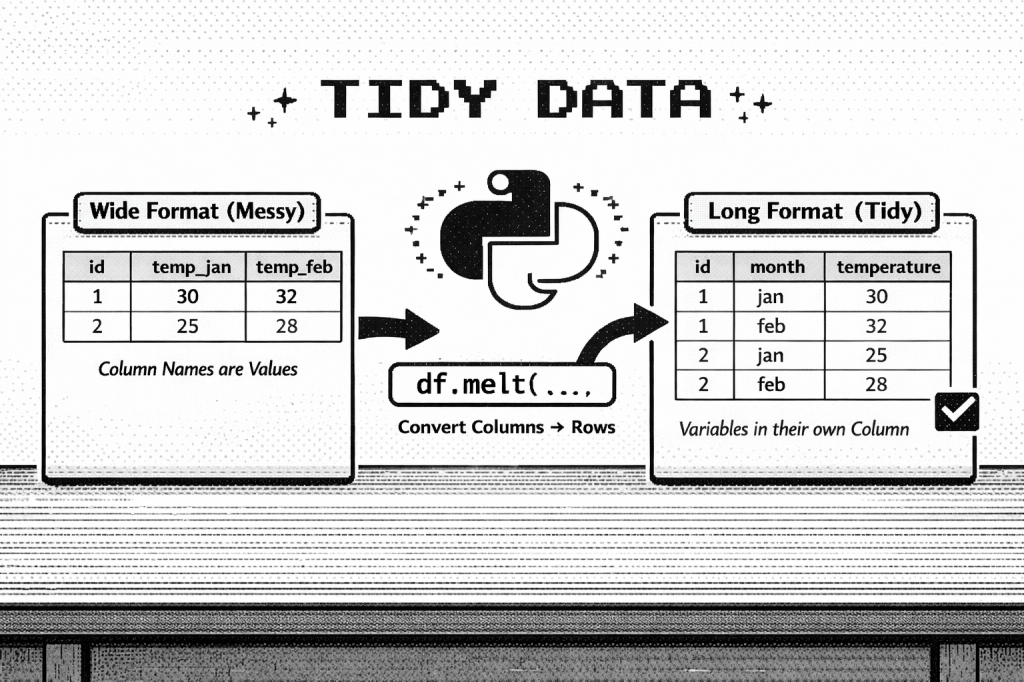
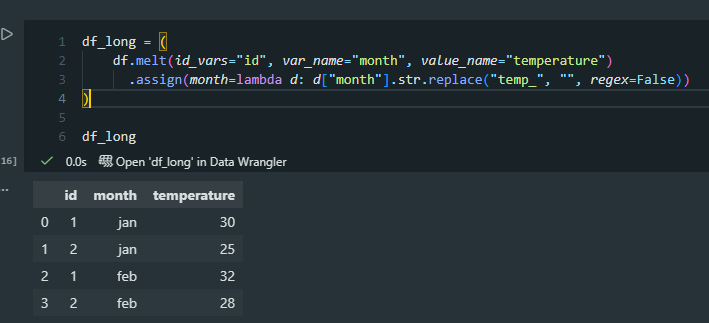
First, we recreate the “messy” table as a pandas DataFrame. (This is the example from the featured image at the top of this post.)
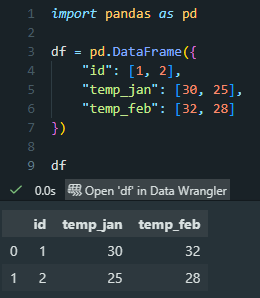
And then we convert this into tidy data using melt(). In this step, I use assign() to fix the variables. More specifically, I create a new column (“month”) and then replace “temp_” with an empty string (“”) for all its values, so we get only the abbreviated month name as our variable.
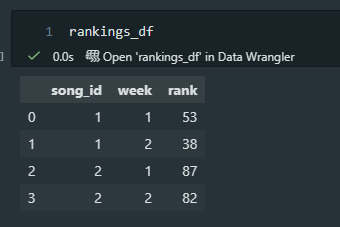
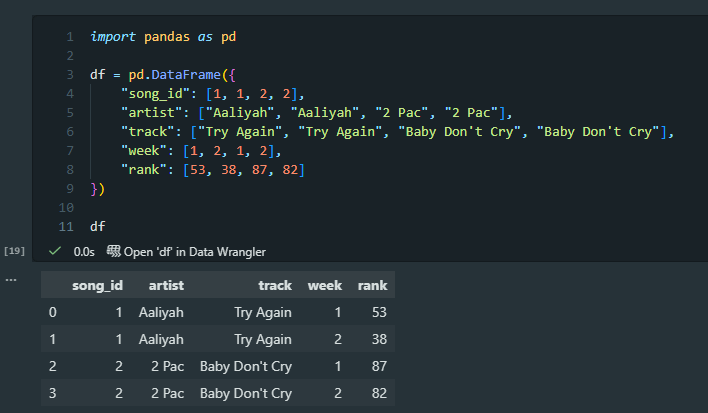
Finally, I recreated Wickham’s example of a table that has too many observational units. In this case, it’s a table displaying song-level information and then weekly ranking information. We should split these into two tables.
Here is the code to create two new pandas DataFrames, songs_df and rankings_df.
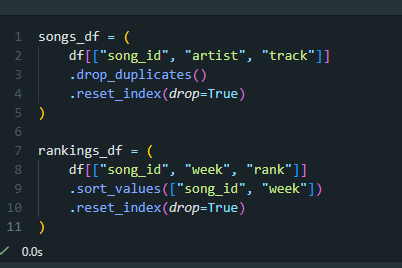
And that outputs two tables, shown below.